MENU
Copyright ©2018 Luoyang Aurora Minechem Co., Limited All rights reserved
↵Luoyang Aurora Minechem Co., Ltd.
info@lyaurora.com
Ph +86 186 137 00893
Ph +86 186 137 08187
Ph +86 186 383 53099

NEWS MENU
Fluorspar Market Analysis in Jan to May 2019
Fluorspar Market Analysis in Jan to May 2019 and 2018
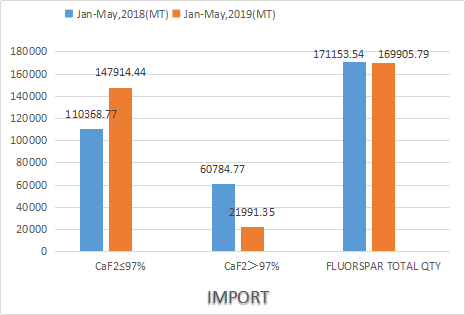
The below bar chart illustrates that the import volume of Fluorspar(CaF2>97%) declined 63.8% in January-May, 2019 than last year. However the import volume of Fluorspar (CaF2 ≤97%) went up 34% than in January-May, 2018. And total import quantity has a slight decline.
It is clear from the below chart, the export volume of Fluorspar (CaF2>97%) increased by 14.4% in January-May, 2019 than in 2018. While the export volume of Fluorspar (CaF2≤97%) reduced 18.4% than the same period in January-May, 2018.
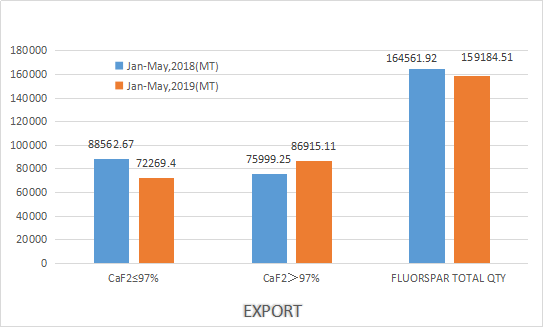
We can conclude that import volume for CaF2 above 97% reduced but export volume was increasing compared with last year. We can learn that that’s why acid fluorspar is on the high side with a shortage of supply.
What’s more, for CaF2 below 97%, the import volume increased with export volume reducing, it indicates that China imported metallurgical grade fluorspar to process acid fluorspar, then export to the worldwide.
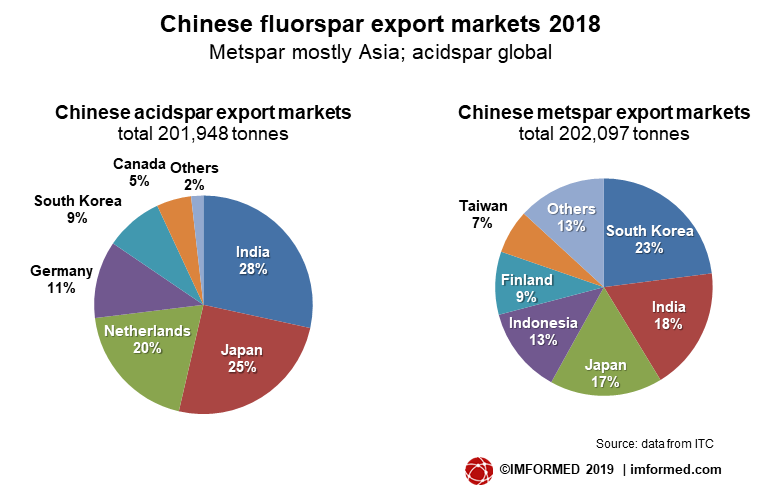
Chinese fluorspar export markets 2018